Knowing your audience is the foundation of growth. Station gives you clear, actionable analytics so you can understand who’s engaging, what they care about, and how your content is performing — all in one place.
Overview
Emails
Link-in-Bio
Newsletter
Community
Each section helps you understand how fans are interacting with your content and where your growth is coming from.
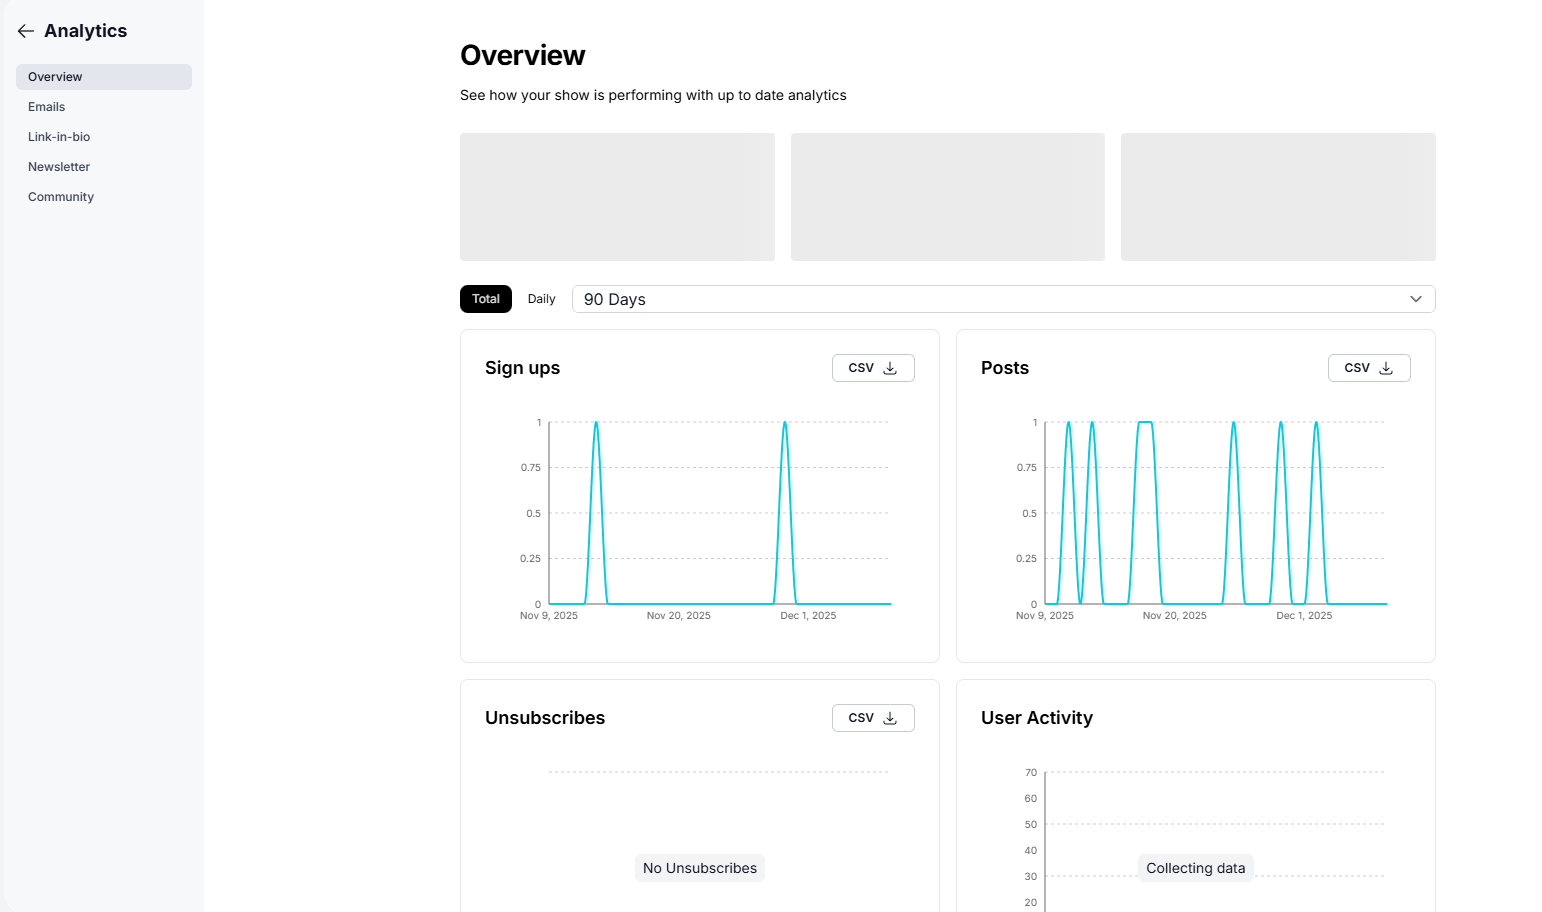
This is the default view when you open Analytics. It includes:
Track how many new subscribers joined your Station over time. Spikes often happen after new episodes, events, giveaways, or promotions.
See how often you’ve posted across your Station community. Regular posting boosts engagement and keeps your community active.
Monitor whether people are opting out. This helps you adjust content, email frequency, and engagement strategies.
See how active your audience is inside your community—likes, comments, posts, and other interactions.
(If new, this may show “Collecting data” until your community becomes active.)
Each chart can be filtered by:
Daily or Total
Custom date ranges (7 / 30 / 90 days)
And exported as a CSV for sponsor reports or team analysis.
If sign-ups spike after a certain episode or post, double down on that type of content.
Sudden drops or unsubscribes may indicate content fatigue or messaging overload.
High User Activity = stronger connections and more opportunities for monetization.
Export your data to highlight engagement, growth, and audience behavior.
Check your analytics weekly. Small shifts—like adjusting your posting cadence or highlighting your strongest content—create compounding growth over time.
 Next Step
Dive deeper into Email Performance to understand how your newsletters and episode emails are landing with your audience.